Adidas US Sales Analysis
Interactive dashboard analyzing sales trends and product performance
Project Overview
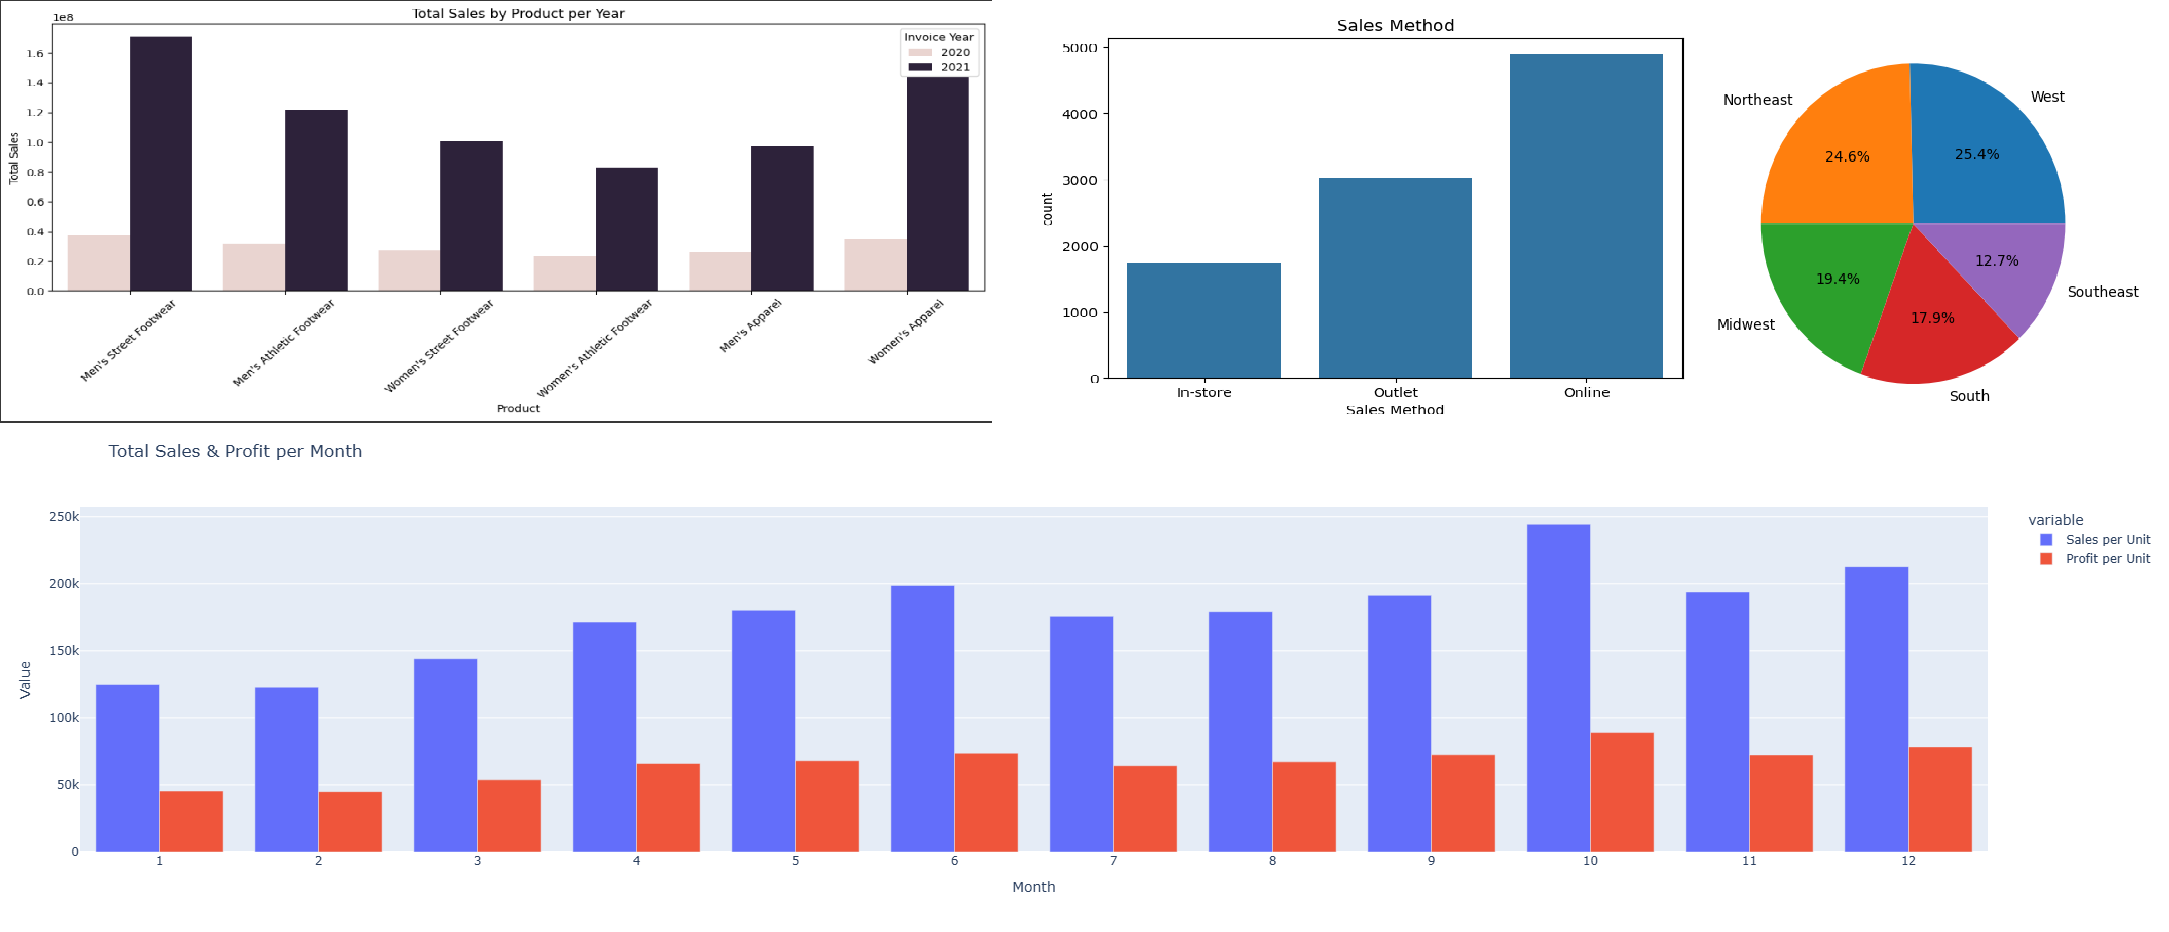
Built an interactive dashboard analyzing Adidas sales & profit trends, product performance, and regional market share. Helped uncover seasonal patterns and top-performing categories using Python data science tools.
Dashboard
Tools & Technologies
- Python (Pandas, NumPy)
- Matplotlib & Seaborn
- Plotly for Interactive Charts
- Dash for Web Dashboard
- Data Cleaning & Preprocessing
- Statistical Analysis
Problem Statement
Adidas needed comprehensive analysis of their US market performance:
- Identify seasonal sales patterns and trends
- Analyze product category performance
- Understand regional market variations
- Track profit margins across different segments
- Optimize inventory and marketing strategies
Solution Approach
Developed an interactive Python dashboard featuring:
- Time series analysis of sales trends
- Product category performance comparisons
- Regional market share analysis
- Profit margin optimization insights
- Seasonal pattern identification
- Interactive filtering and drill-down capabilities
Outcomes & Insights
Key findings that influenced business strategy:
- Seasonal Trends: Q4 sales peak with 45% increase
- Top Categories: Running shoes led with 30% market share
- Regional Performance: California showed highest growth at 25%
- Profit Margins: Premium products had 40% higher margins
- Growth Opportunities: Women's segment showed 20% growth potential