Sales Analysis Dashboard
Interactive sales metrics monitoring and strategic decision-making platform
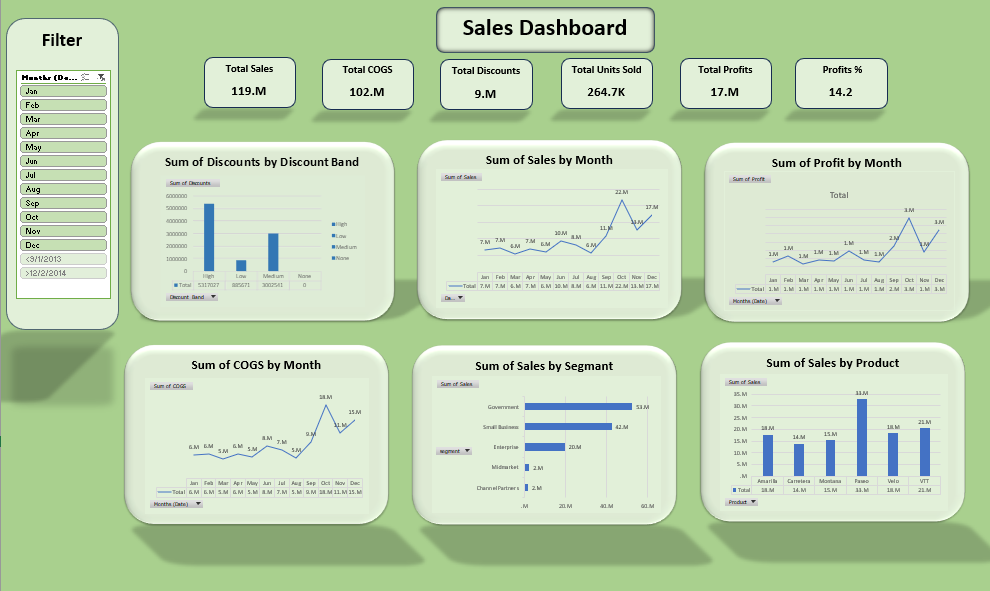
Project Overview
Created a comprehensive sales analysis dashboard to monitor key sales metrics. Interactive charts allowed analysis by month, product, and customer segment for strategic decision-making and performance optimization.
Dashboard
Tools & Technologies
- Microsoft Excel (Advanced)
- Pivot Tables & Charts
- Excel Dashboard Creation
- Data Validation & Cleaning
- Conditional Formatting
- Interactive Controls
Problem Statement
The company needed a centralized dashboard to track and analyze sales performance across multiple dimensions:
- Lack of real-time sales visibility
- Difficulty in identifying top-performing products
- No clear view of customer segment performance
- Manual reporting processes were time-consuming
- Inability to track monthly trends effectively
Solution Approach
Developed an interactive Excel dashboard featuring:
- Dynamic pivot tables with slicers
- Multiple chart types (bar, line, pie)
- KPI metrics with conditional formatting
- Month-over-month comparison views
- Product performance rankings
- Customer segment analysis
Outcomes & Insights
Key insights that transformed sales strategy:
- Sales Growth: Identified 25% growth opportunity in Q3
- Top Products: Electronics category led with 35% of total sales
- Customer Segments: Premium customers showed 50% higher lifetime value
- Seasonal Patterns: December sales peak identified for inventory planning
- Performance Metrics: Average order value increased by 18%