Startup Expansion Dashboard
Regional expansion strategy optimization and performance tracking
Project Overview
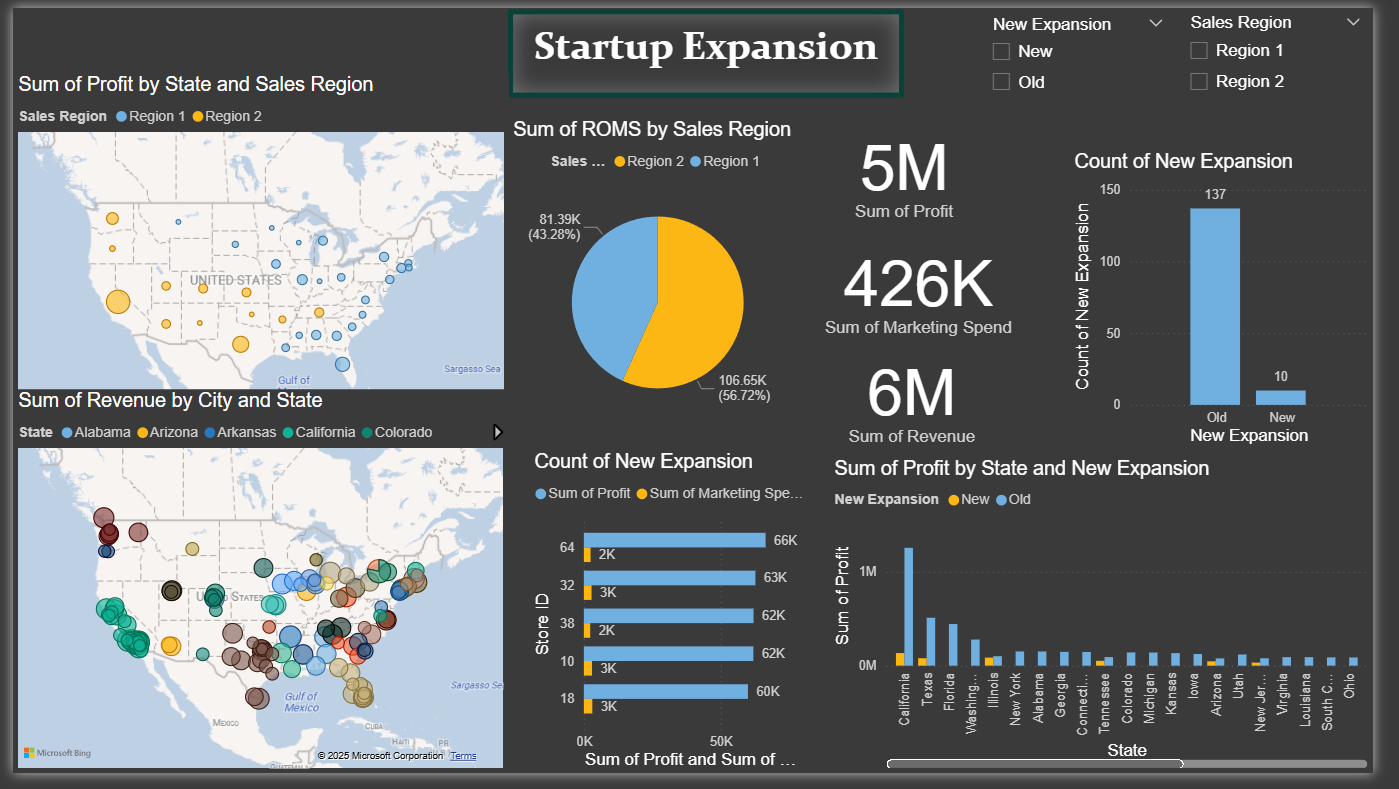
Built an interactive dashboard to track profit, revenue, and marketing spend across U.S. regions, helping optimize expansion strategies and identify growth opportunities for a fast-growing startup.
Dashboard
Tools & Technologies
- Microsoft Power BI
- Python (Pandas, Matplotlib)
- Data Visualization
- Business Intelligence
- Interactive Dashboards
- Statistical Analysis
Problem Statement
The startup needed to make data-driven decisions for their U.S. expansion strategy:
- Unclear ROI on marketing spend across regions
- No visibility into regional profitability
- Difficulty identifying optimal expansion markets
- Lack of unified view of performance metrics
- Need to optimize resource allocation
Solution Approach
Created a comprehensive Power BI dashboard with Python integration:
- Regional performance heat maps
- Marketing spend vs. revenue analysis
- Profit margin comparisons
- Growth rate tracking
- Market penetration metrics
- Predictive expansion recommendations
Outcomes & Insights
Strategic insights that guided expansion decisions:
- Top Markets: West Coast showed 40% higher ROI
- Marketing Efficiency: Digital campaigns outperformed traditional by 60%
- Profit Margins: Southeast region had highest margins at 35%
- Growth Potential: Texas market identified for next expansion
- Resource Optimization: Reduced marketing spend by 20% while maintaining growth