Super Store Analysis
Comprehensive sales performance analysis and business intelligence dashboard
Project Overview
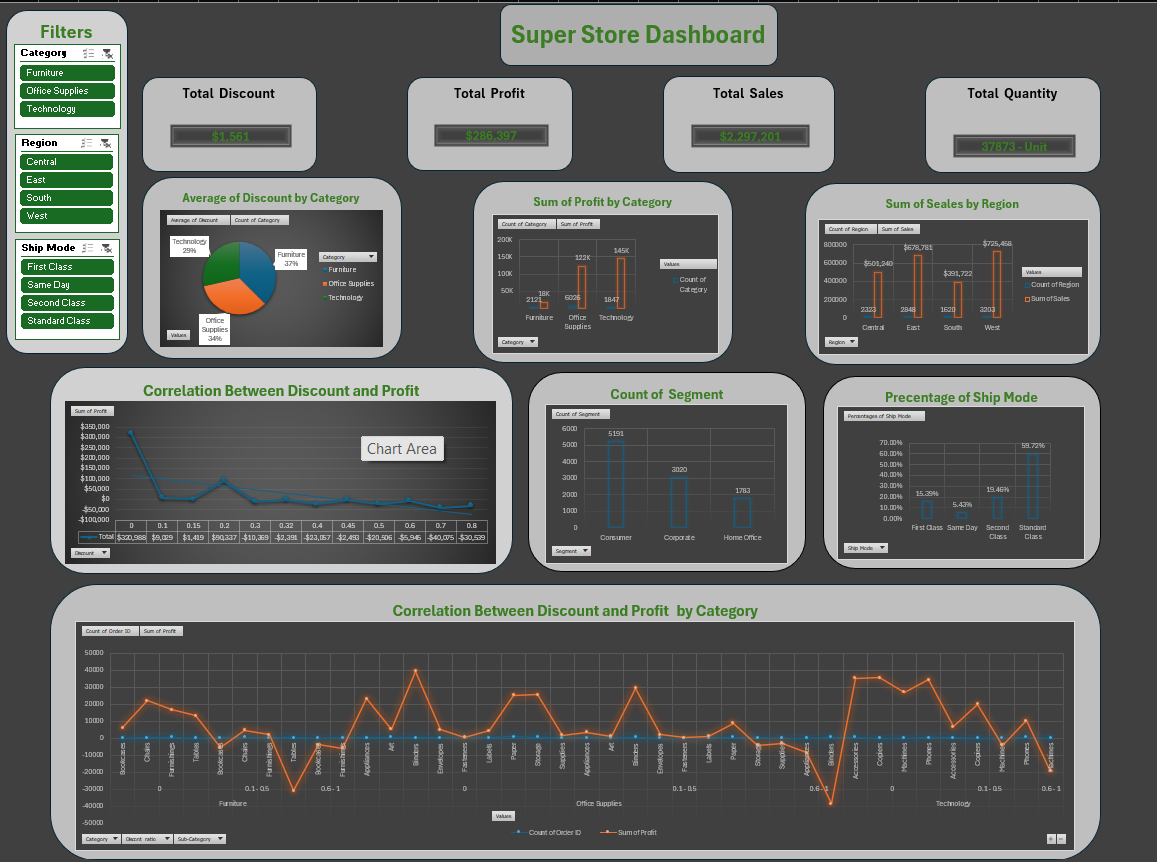
Developed an interactive sales dashboard for a superstore to analyze performance across categories, regions, and shipping methods. This comprehensive analysis provided actionable insights for business optimization and strategic decision-making.
Dashboard
Tools & Technologies
- Microsoft Excel (Advanced)
- Pivot Tables & Charts
- Excel Formulas & Functions
- Dashboard Creation
- Data Visualization
Problem Statement
The superstore was experiencing declining sales performance and needed to identify key areas for improvement. Management required a comprehensive analysis to understand:
- Which product categories were underperforming
- Regional sales variations and opportunities
- Impact of different shipping methods on profitability
- Seasonal trends and patterns
- Customer segment performance
Solution Approach
Created a comprehensive Excel-based dashboard that included:
- Interactive pivot tables for data exploration
- Dynamic charts showing sales trends
- Regional performance comparisons
- Category-wise profitability analysis
- Shipping method impact assessment
Outcomes & Insights
Key findings that drove business decisions:
- Top Performing Categories: Technology and Office Supplies showed highest profitability
- Regional Opportunities: West Coast region had 15% growth potential
- Shipping Optimization: Standard shipping was most cost-effective for orders over $100
- Seasonal Trends: Q4 showed 40% increase in sales across all categories
- Customer Segments: Corporate customers generated 60% of total revenue